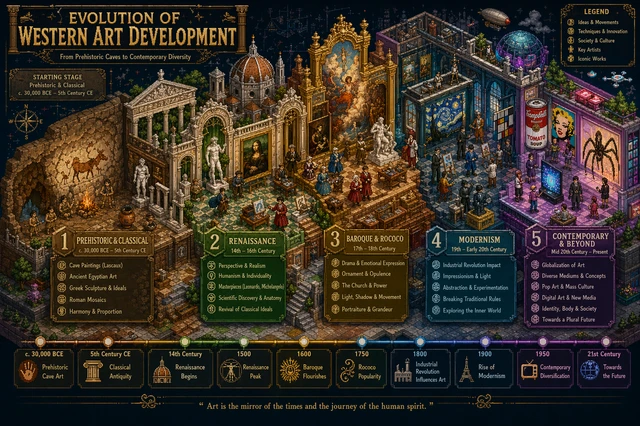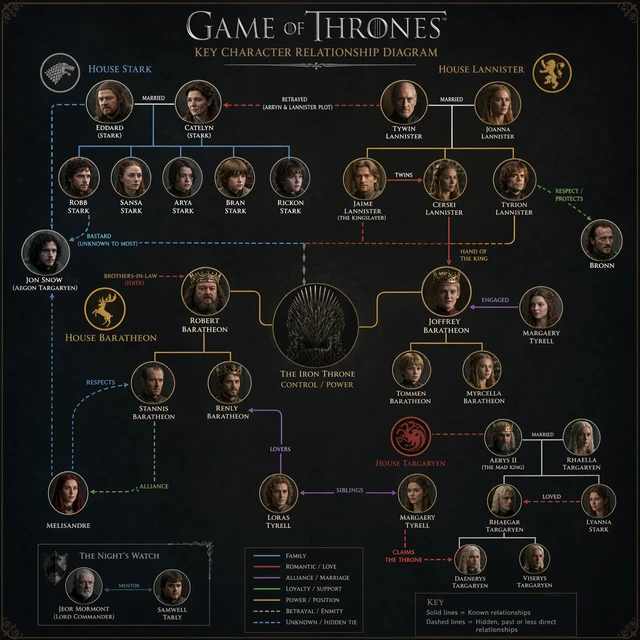
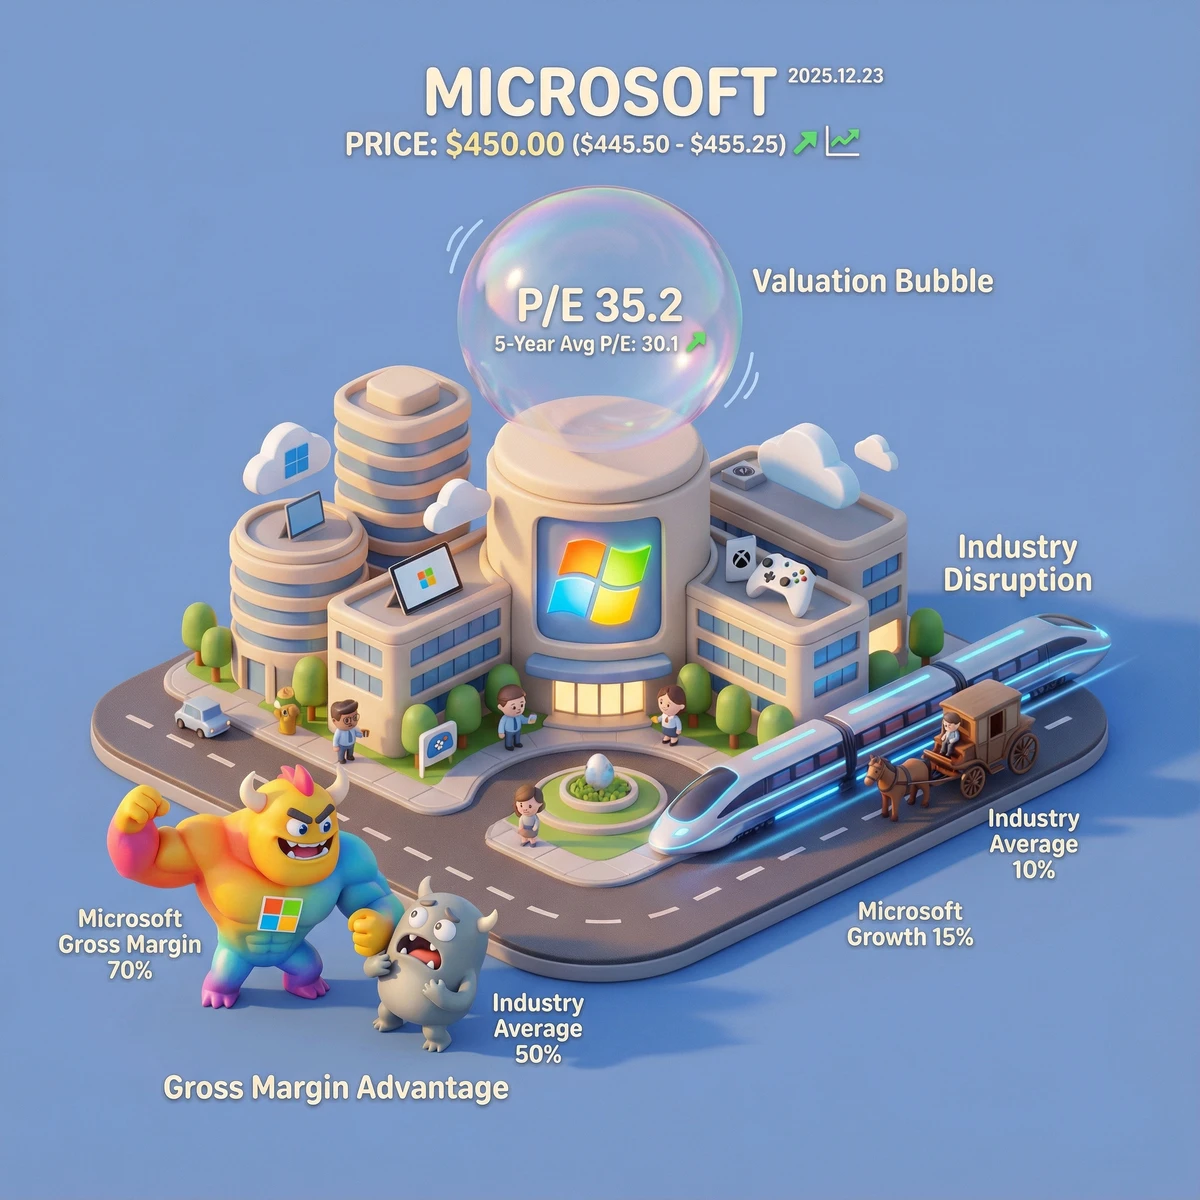
Render an exquisite, miniature 3D cartoon-style scene corresponding to the user-specified company name or ticker, displayed clearly from a 45° top-down perspective. Significantly position the company's most iconic building or campus at the center, complemented by scaled-down key product icons, cute cartoon-style characters, vehicles, and other elements showcasing the company's daily activities. The scene should be rich in detail, meticulously crafted, and full of playfulness. Rendered using Cinema 4D, the modeling should be refined, rounded and smooth, richly textured, and accurately capture realistic PBR materials. Soft realistic lighting and shadows create a warm and cozy atmosphere. Creatively integrate the company's real-time stock market data and three core comparative investment metrics for the user-specified date (or the automatically retrieved current date) into the scene, maintaining a clean minimalist layout and a solid color background to highlight the main content. Key Financial Visualization Integration: Gross Margin Advantage (Monster Showdown): Near the foreground, use two contrasting cartoon monsters to visualize the gross margin comparison. Hero Monster: A large, strong, brightly colored monster labeled "{Company} Gross Margin [Value]%," representing the user-input company. Opponent Monster: A smaller, weaker, generic monster labeled "Industry Average [Value]%," representing the industry average. Logic: If the company's margin is higher, the Hero Monster overpowers the opponent; if lower, it appears cowering. P/E Valuation & Risk (Bubble): Floating directly above the main building, showing a "Valuation Bubble" labeled "P/E [Value]." Visual Logic: Compare the current P/E ratio with the company's 5-year historical average (PEG). If P/E is historically high/overvalued: The bubble is giant, thin, iridescent, and trembling (about to burst). If P/E is fair/undervalued: The bubble appears as a solid, stable crystal sphere or a small bubble with thick walls. Industry Disruption (Growth Speed): Use the annual revenue growth rate (YoY) metric compared to the industry average to visualize the company's disruptive capability. Use a "Speed/Transportation Metaphor" on the street next to the building: Disruptor: A futuristic high-speed vehicle (such as a maglev train or rocket) labeled "{Company} Growth [Value]%" speeding past. Incumbent: A slow, outdated vehicle (such as a horse carriage or bicycle) labeled "Industry Average [Value]%" moving sluggishly. Logic: This strictly demonstrates how fast the company is growing compared to industry norms. At the top center of the scene, highlight the company name or ticker in a large font, followed by the specified date in an extra-small font, and the stock price range in a medium font. Include clear and intuitive stock trend icons and charts next to the price. All text should be displayed in the user-specified language or the language of the input, without any background, and can subtly overlap with scene elements to enhance overall design integration. Very Important: Before generation, ensure accurate and up-to-date stock market data is retrieved based on the user-input company name or ticker and the specified date. Specifically retrieve and compare: {Company} Gross Margin vs. {Industry} Average Gross Margin. {Company} current P/E ratio vs. its 5-year historical range. {Company} Revenue Growth Rate (YoY) vs. {Industry} Average Growth Rate (this is the measure of disruption). If such detailed data is unavailable, use the latest available quarterly data and notify the user. Parameters: Aspect Ratio: {1:1} Date: {2025.12.23} Company Name or Ticker: {Microsoft}
Model
Nano banana pro
Resolution
2048 × 2048 px